The Google Ads Reporting section within the Reporting Tab enables you to view and analyze detailed statistics related to your Google Ads campaigns. You can access data for campaigns, ad groups, ads, and even keywords, offering a comprehensive view of your advertising performance—all without leaving your platform.
Click the Google Ads Report button to get started.
Submit Feedback #
If you notice discrepancies between the dashboard and your Google Ads account, you can use the Submit Feedback button. This feature opens a sidebar where you can compose a message, add a subject, and attach files to describe the issue. Click the green Send Message button once you’ve filled out the form.

Selecting Date Range #
Choose a custom date range to view reports for your desired period. Simply click the calendar icon in the top-right corner, select the date range, and confirm with the green checkmark icon to refresh the data.

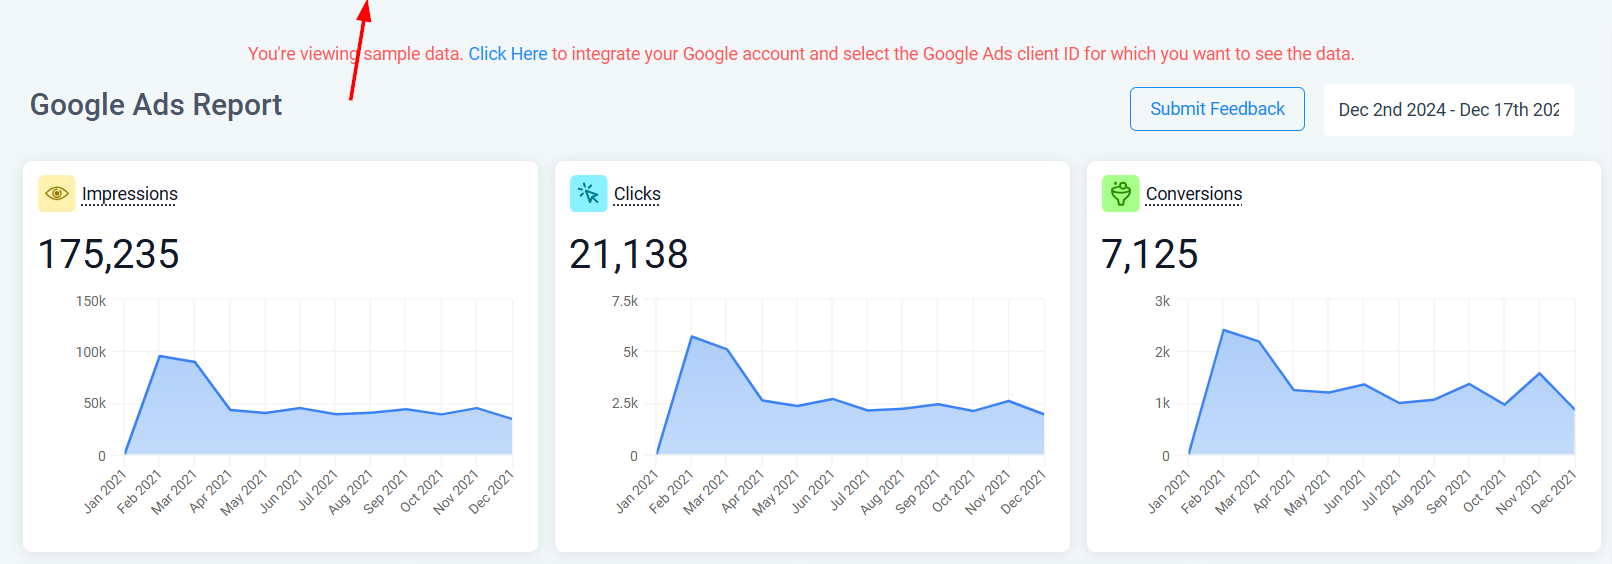
Key Metrics Breakdown #
Impressions #
View how many times your ads were displayed over a selected date range. This data is presented visually, allowing for daily, weekly, or monthly trend analysis.

Clicks #
Analyze the number of users who clicked on your ad after seeing it. Clicks are displayed in a visual format based on the chosen date range.

Conversions #
Monitor how many users performed the intended action defined by your campaign’s objective. This metric includes a visual breakdown by day, week, or month.

Campaign Data Insights #
This section provides campaign-level statistics, including changes in performance over time compared to a previous date range. Metrics include:
- Client Spend: Total budget spent on ads.
- Average CPC: Average cost per click.
- Cost Per Conversion: Average cost to generate a conversion.
- Conversion Rate: Conversion performance in percentage.

Campaign Data Table #
Dive deeper into individual campaign performance by viewing the details in the campaign table. Each row includes critical metrics such as Campaign name, status, clicks, cost, revenue, ROI, impressions, CPC, leads, and CPL.

Search Bar #
Quickly locate a specific campaign by typing its name. Campaigns that do not match the text input will disappear, refining your view.

Columns #
Customize the metrics displayed by enabling or disabling specific columns, ensuring your focus remains on the most relevant metrics.

Take advantage of these reporting features to make informed advertising decisions and drive better results for your Google Ad campaigns.
What's your Reaction?
You have reacted on"Google Ads Campaign Analytics"
A few seconds ago


 Subscriptions
 My Orders
 My Wishlist
 Refer & Earn💸
 My Projects
 Conversations
 Website Services
 New Website Request
 Website Addons
 Graphic Design
 Video Production
 Marketing Services
 Get a Marketing Plan
 Local SEO Audit

 Latest Updates
 Consultation Calls
 Tools & Extensions