The Analytics tab in your CRM offers valuable insights into your form submissions and performance. This tool makes it easy to store, organize, and analyze key data, helping you track progress and optimize your forms for better engagement. Let’s dive into the features and functionalities of the Analytics tab.
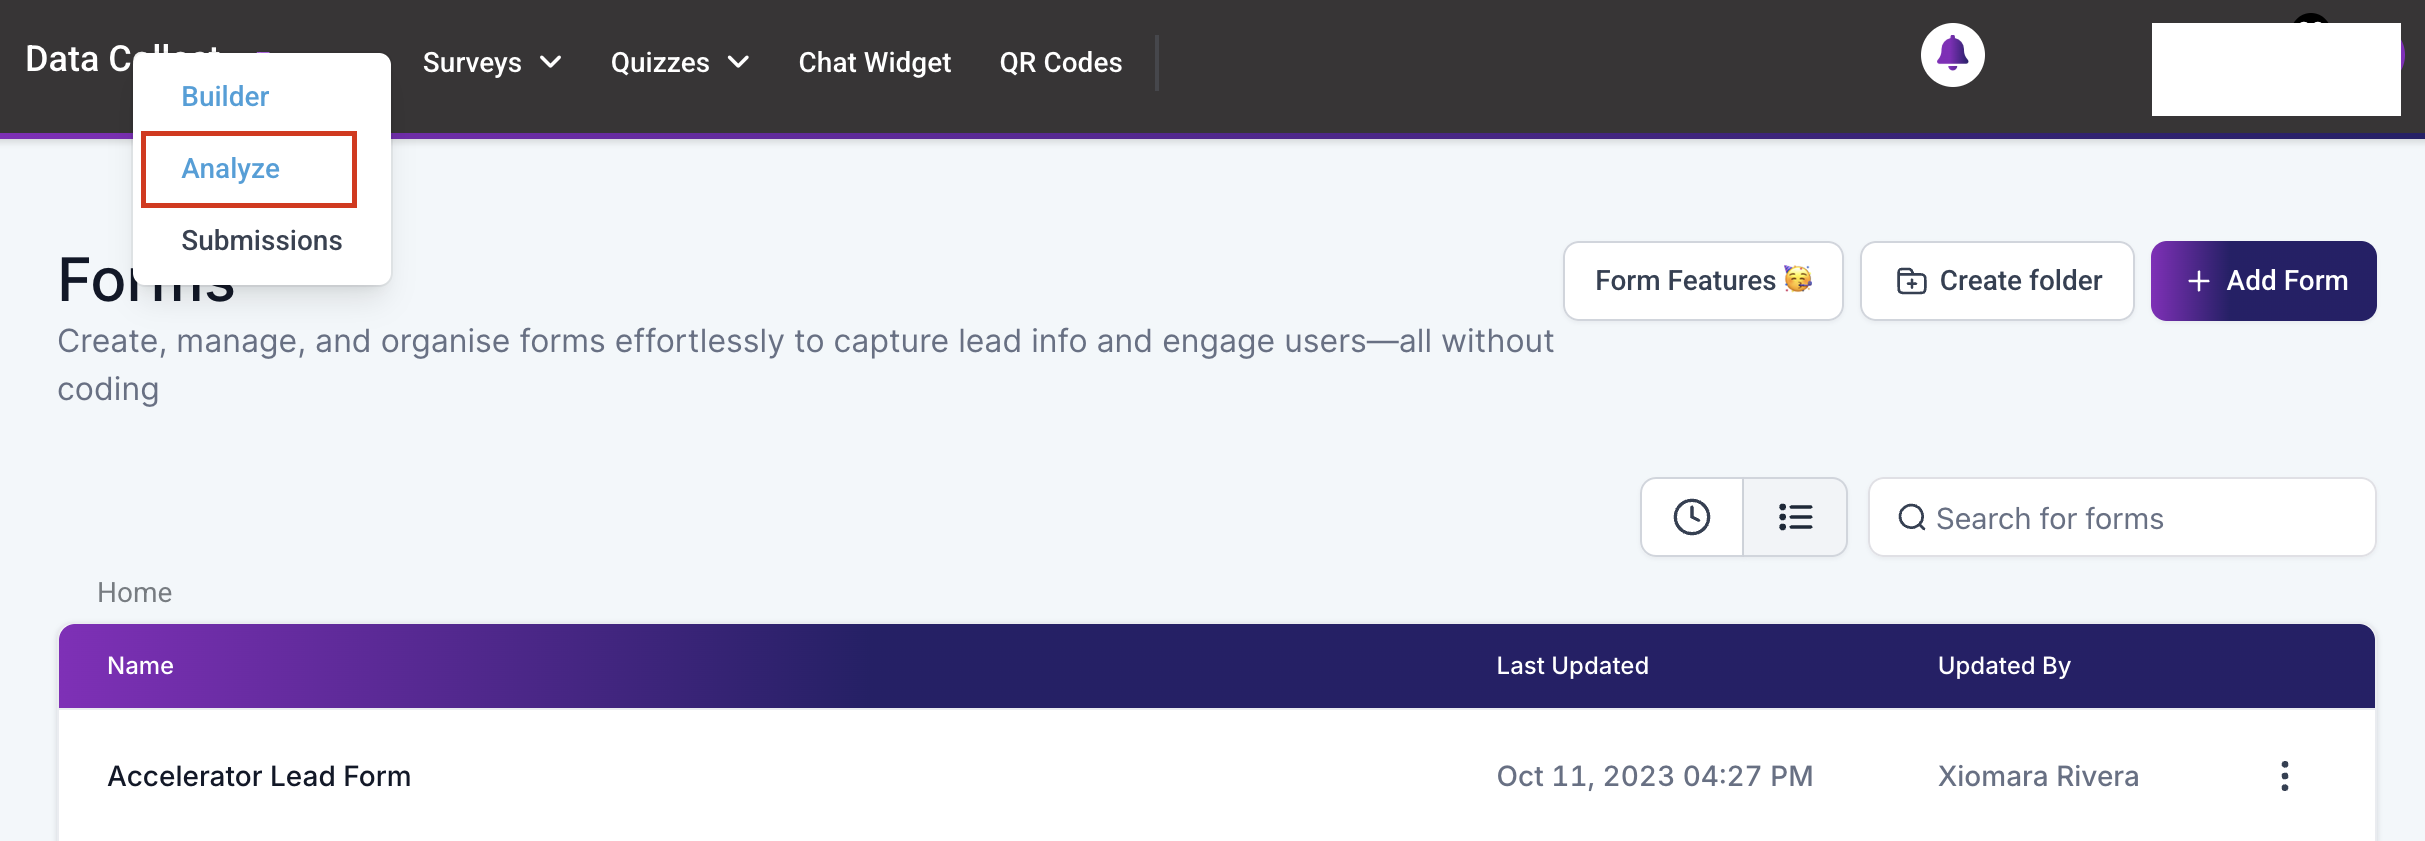
Clicking in on the Analyze option in the Forms dropdown takes to directly to the Analytics tab. There you can view all the analytics of features within the Data Collect section of your CRM.
Features To Analyze #
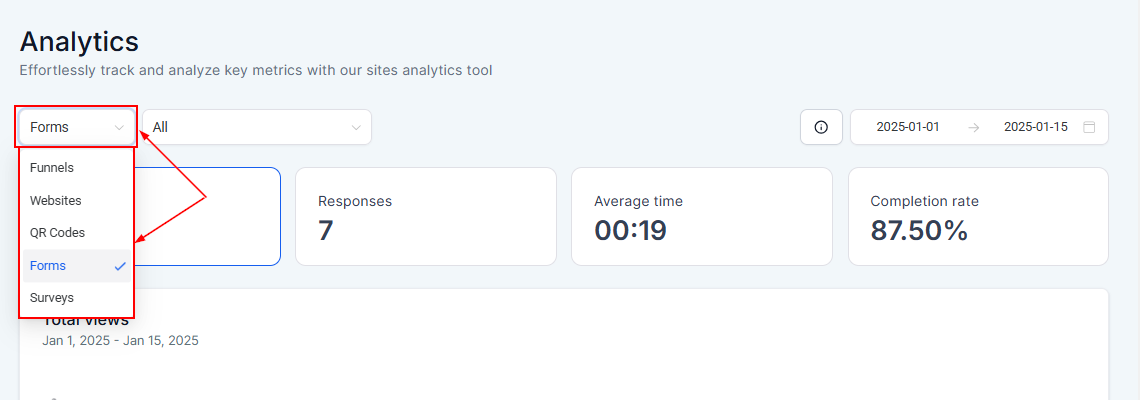
This dropdown allows you to choose from which feature within Data Collect to analyze. For this article, we will be focusing on Forms.
All #
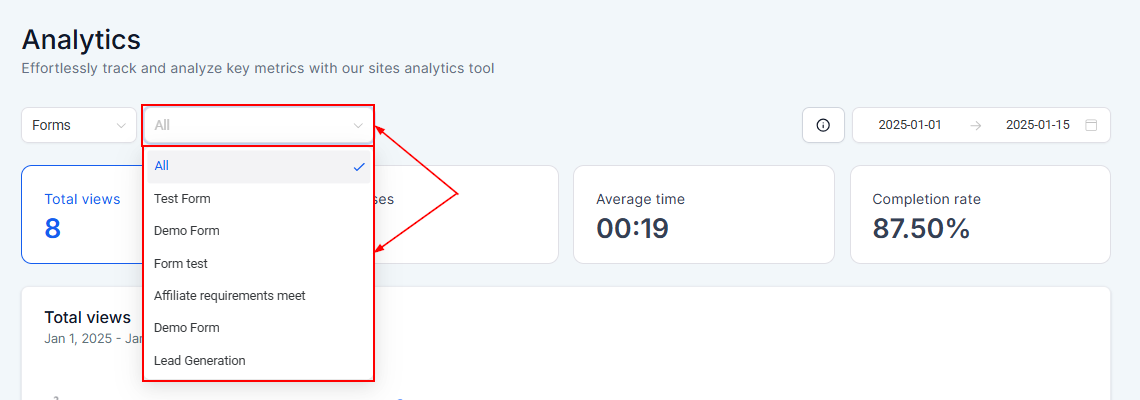
The “All” dropdown aggregates all the forms that have been created within the CRM.
Stats Info #
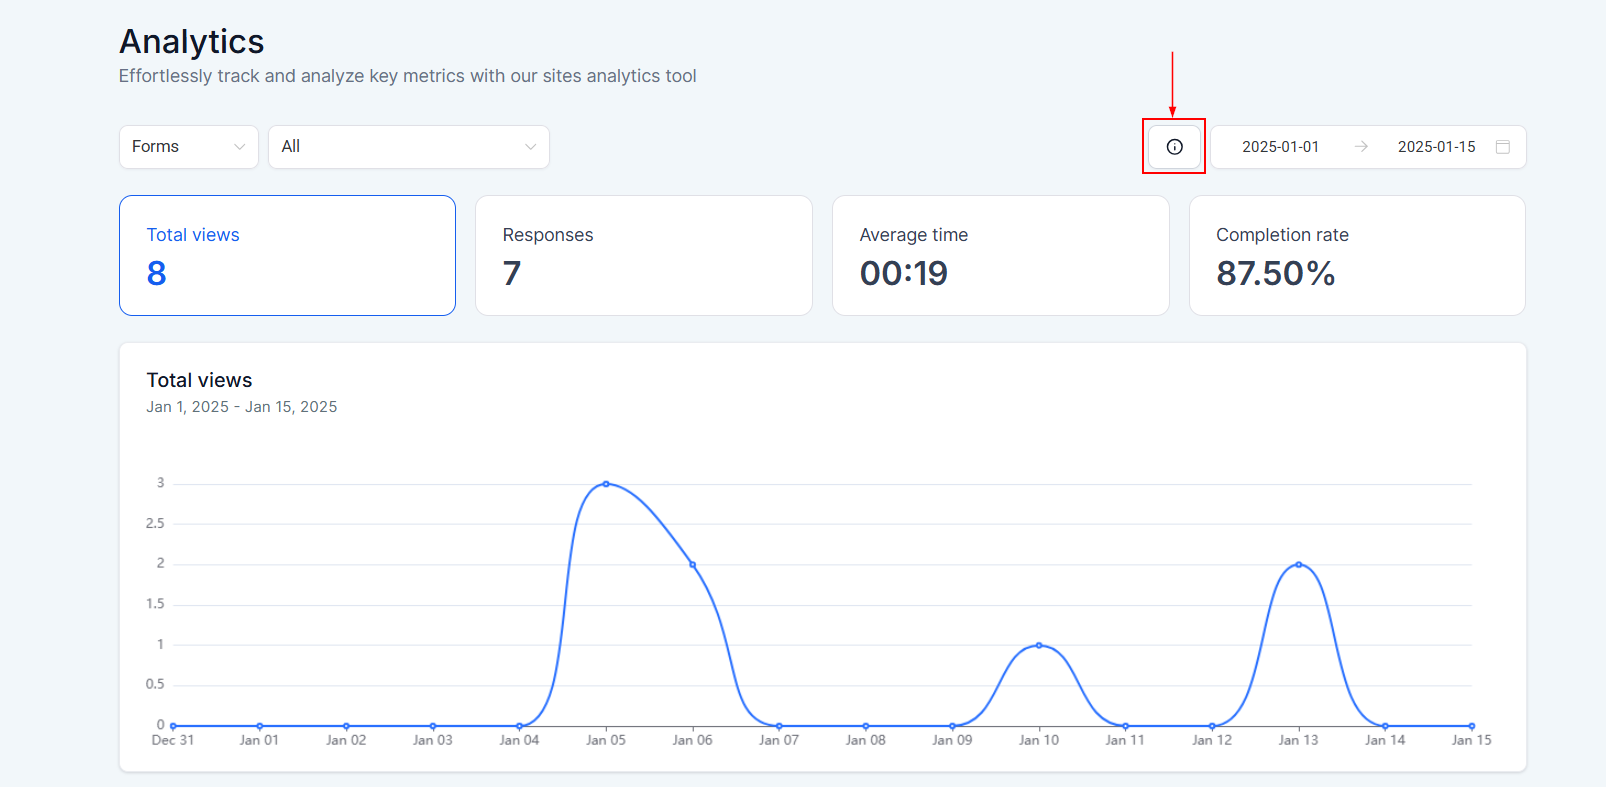
Select the Stats Info button to learn more about the terms used within statistics.
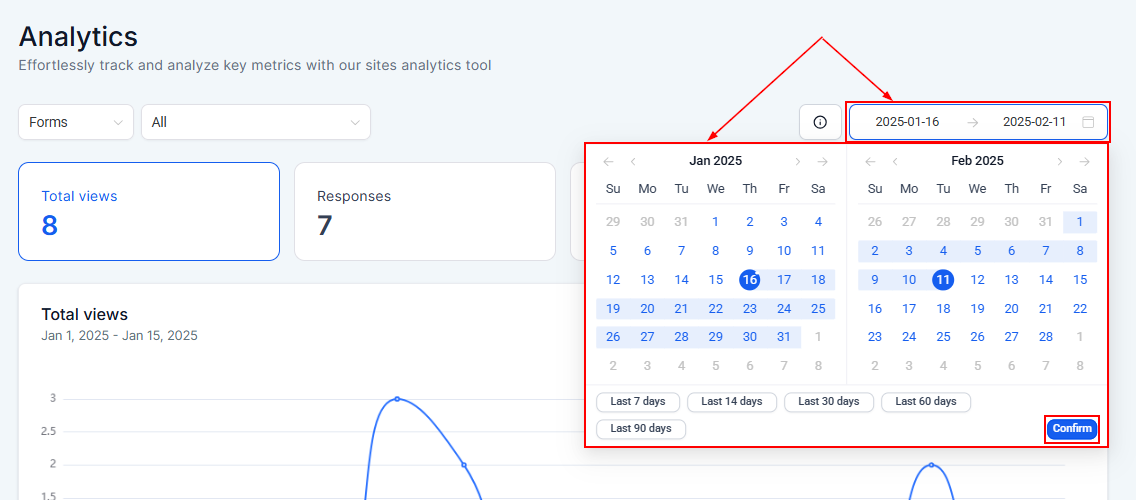
Date Range #
Filter the data to a specific timeframe by using the date selector in the top-right corner. Choose from predefined date ranges or input custom start and end dates, then click the checkmark button to refresh your report with relevant statistics.
Navigating Analytics #
Total Views #
This view helps you track how many users have opened your forms.

Responses #
Here you can view the total number of completed submissions for each form.

Average Time #
This view helps you to analyze how long it typically takes users to complete a form.

Completion Rate #
Here you can easily measure the percentage of users who finish completing the form after starting it.

Data #
Hover over any data point on the graph to view detailed statistics, including the total views, responses, average time, and completion rates. This visualization allows you to quickly assess trends and spot potential issues.

Form List #
Here you will see a list of all statistics for all created Forms.
- Form Name: Here you can see the names of each form created.
- Last Updated: This indicates when the form last received a submission.
- Total View: This allows you to view more detailed analytics for each form

The Analytics tab provides powerful tools to evaluate and enhance your forms’ performance. By leveraging metrics like total views, responses, and completion rates, you can make informed adjustments to optimize your forms.
What's your Reaction?
You have reacted on"Analyze Forms"
A few seconds ago


 Subscriptions
 My Orders
 My Wishlist
 Refer & Earn💸
 My Projects
 Conversations
 Website Services
 New Website Request
 Website Addons
 Graphic Design
 Video Production
 Marketing Services
 Get a Marketing Plan
 Local SEO Audit

 Latest Updates
 Consultation Calls
 Tools & Extensions