Surveys allow you to collect information about your customers in easy-to-follow formats. However, as you send them out responses will vary. The level of interaction and success they have will need to be tracked.
The Analyze tab of your Surveys gives you an overview of how viewers interact with your surveys and how successful they are. You can view your survey analytics in one of these two ways:
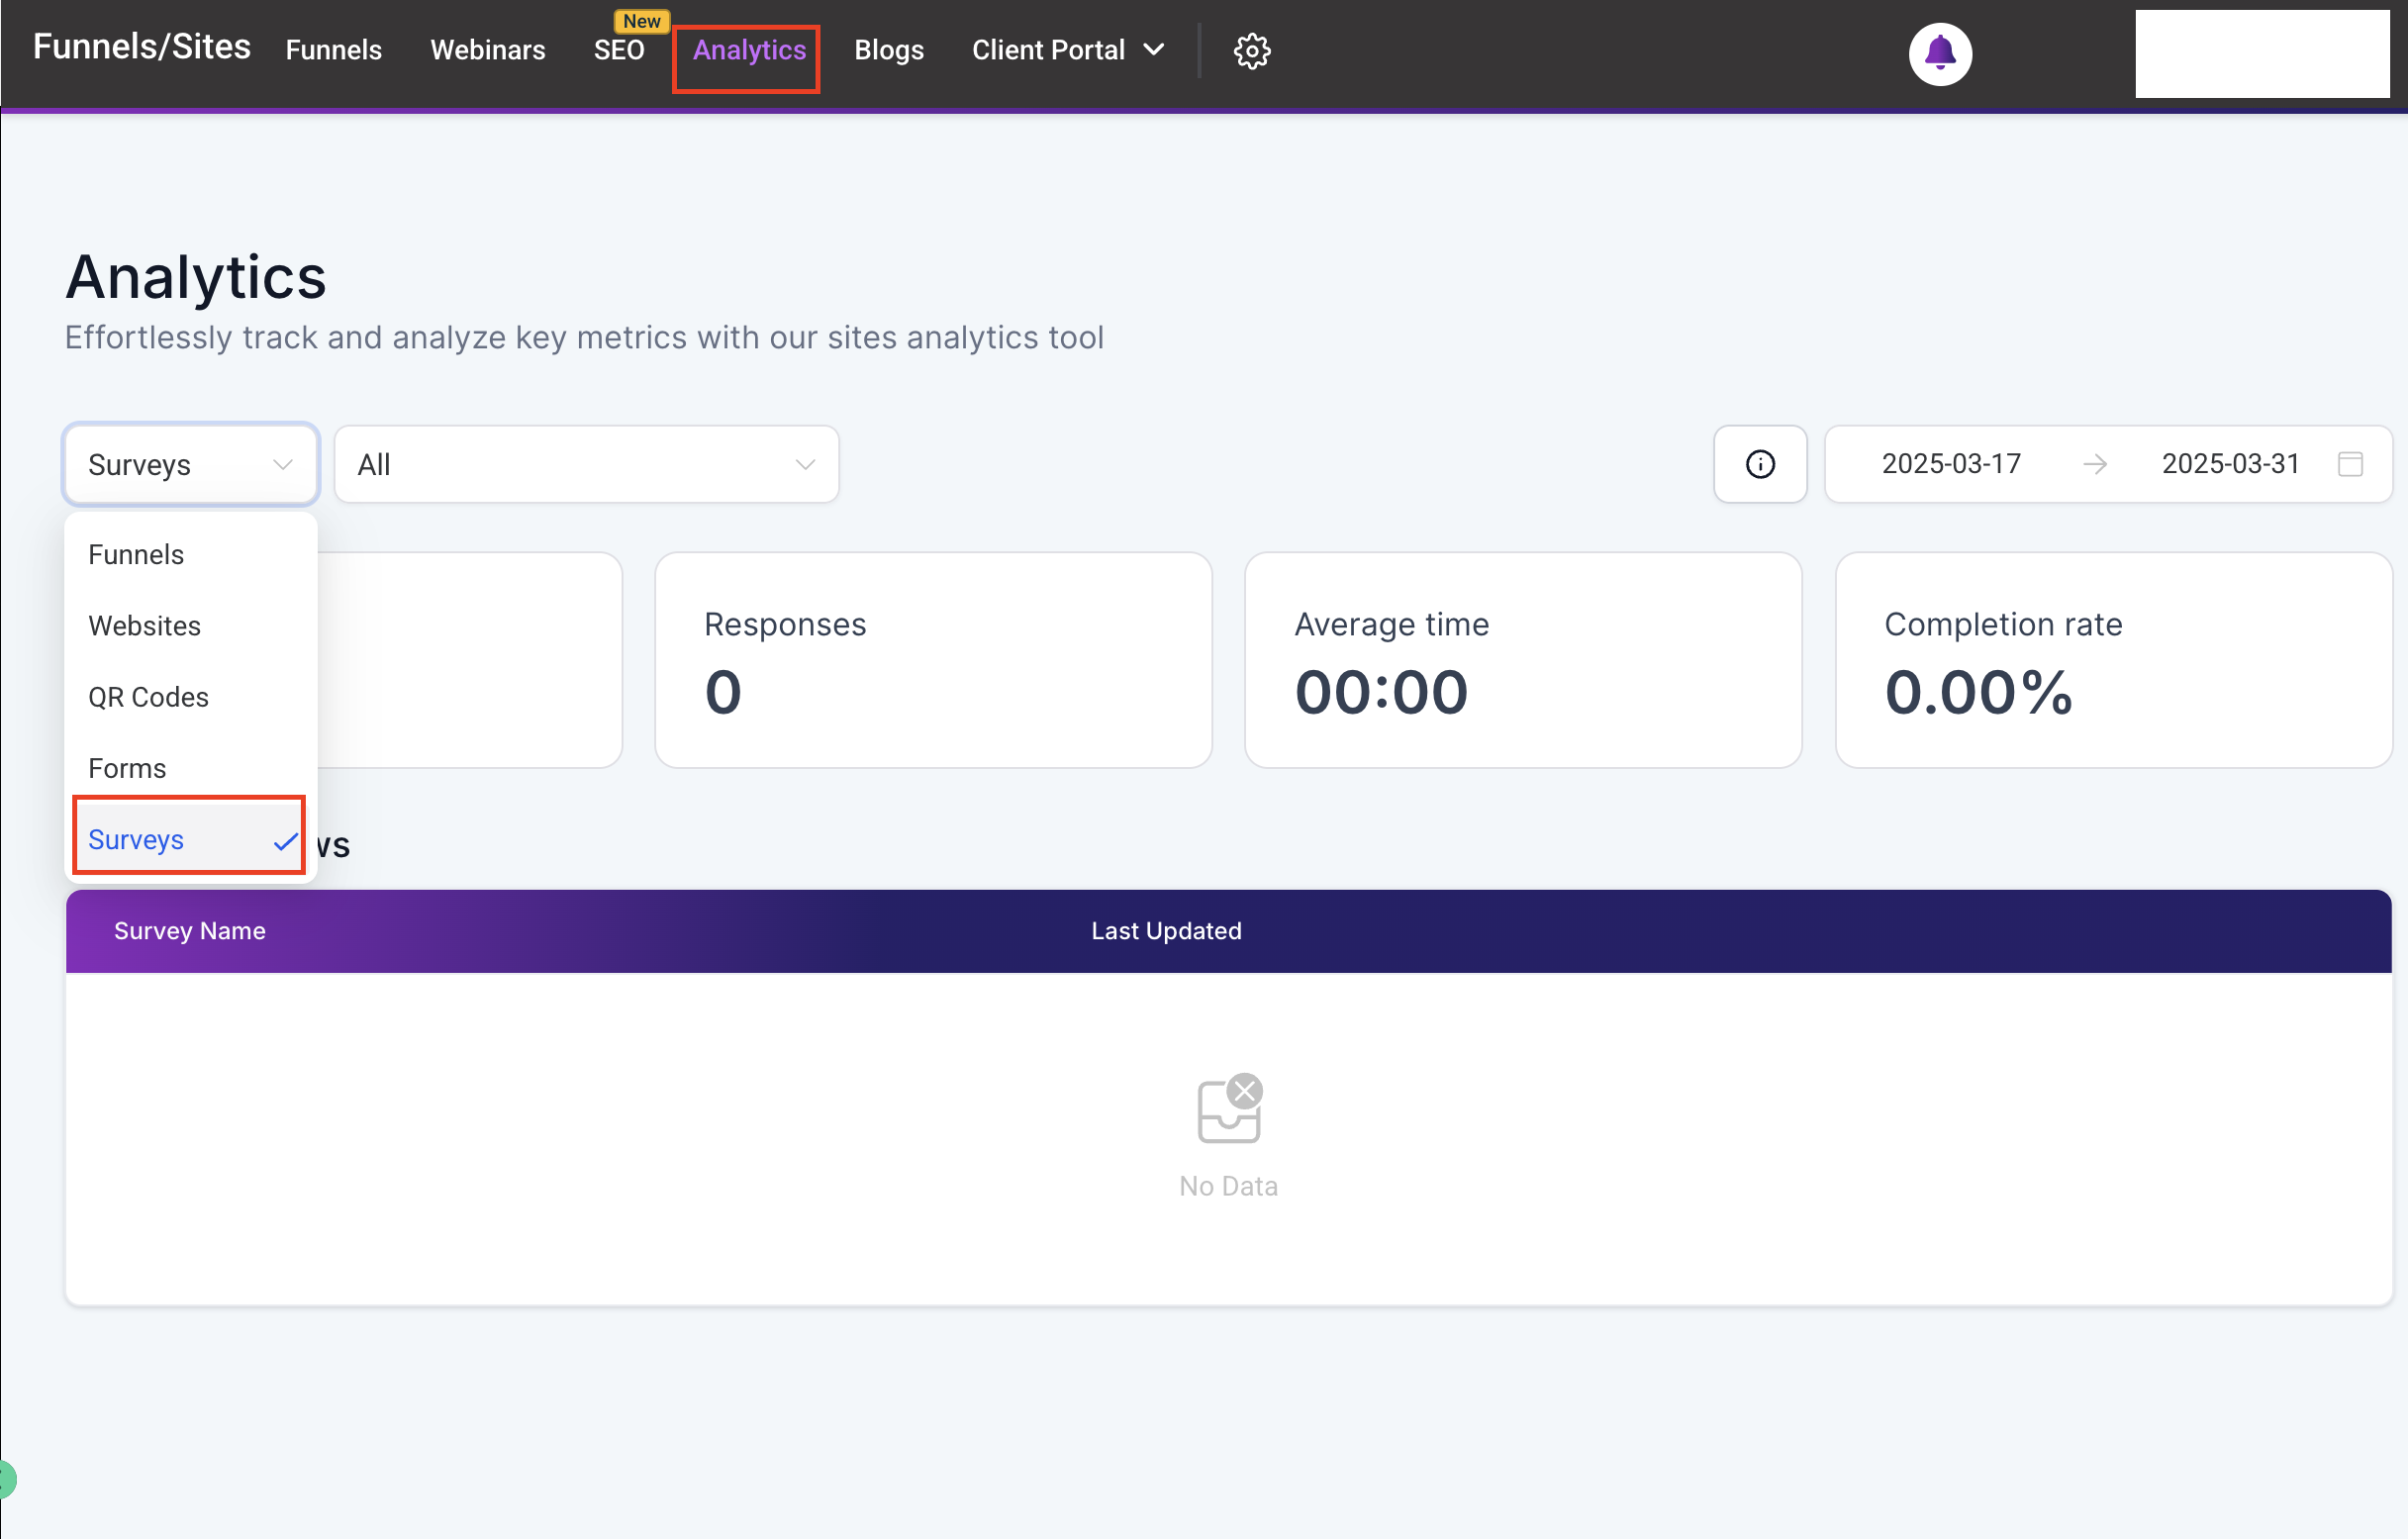
Select the Analytics tab inside your Funnels/Sites section and use the dropdown menu to select Surveys.
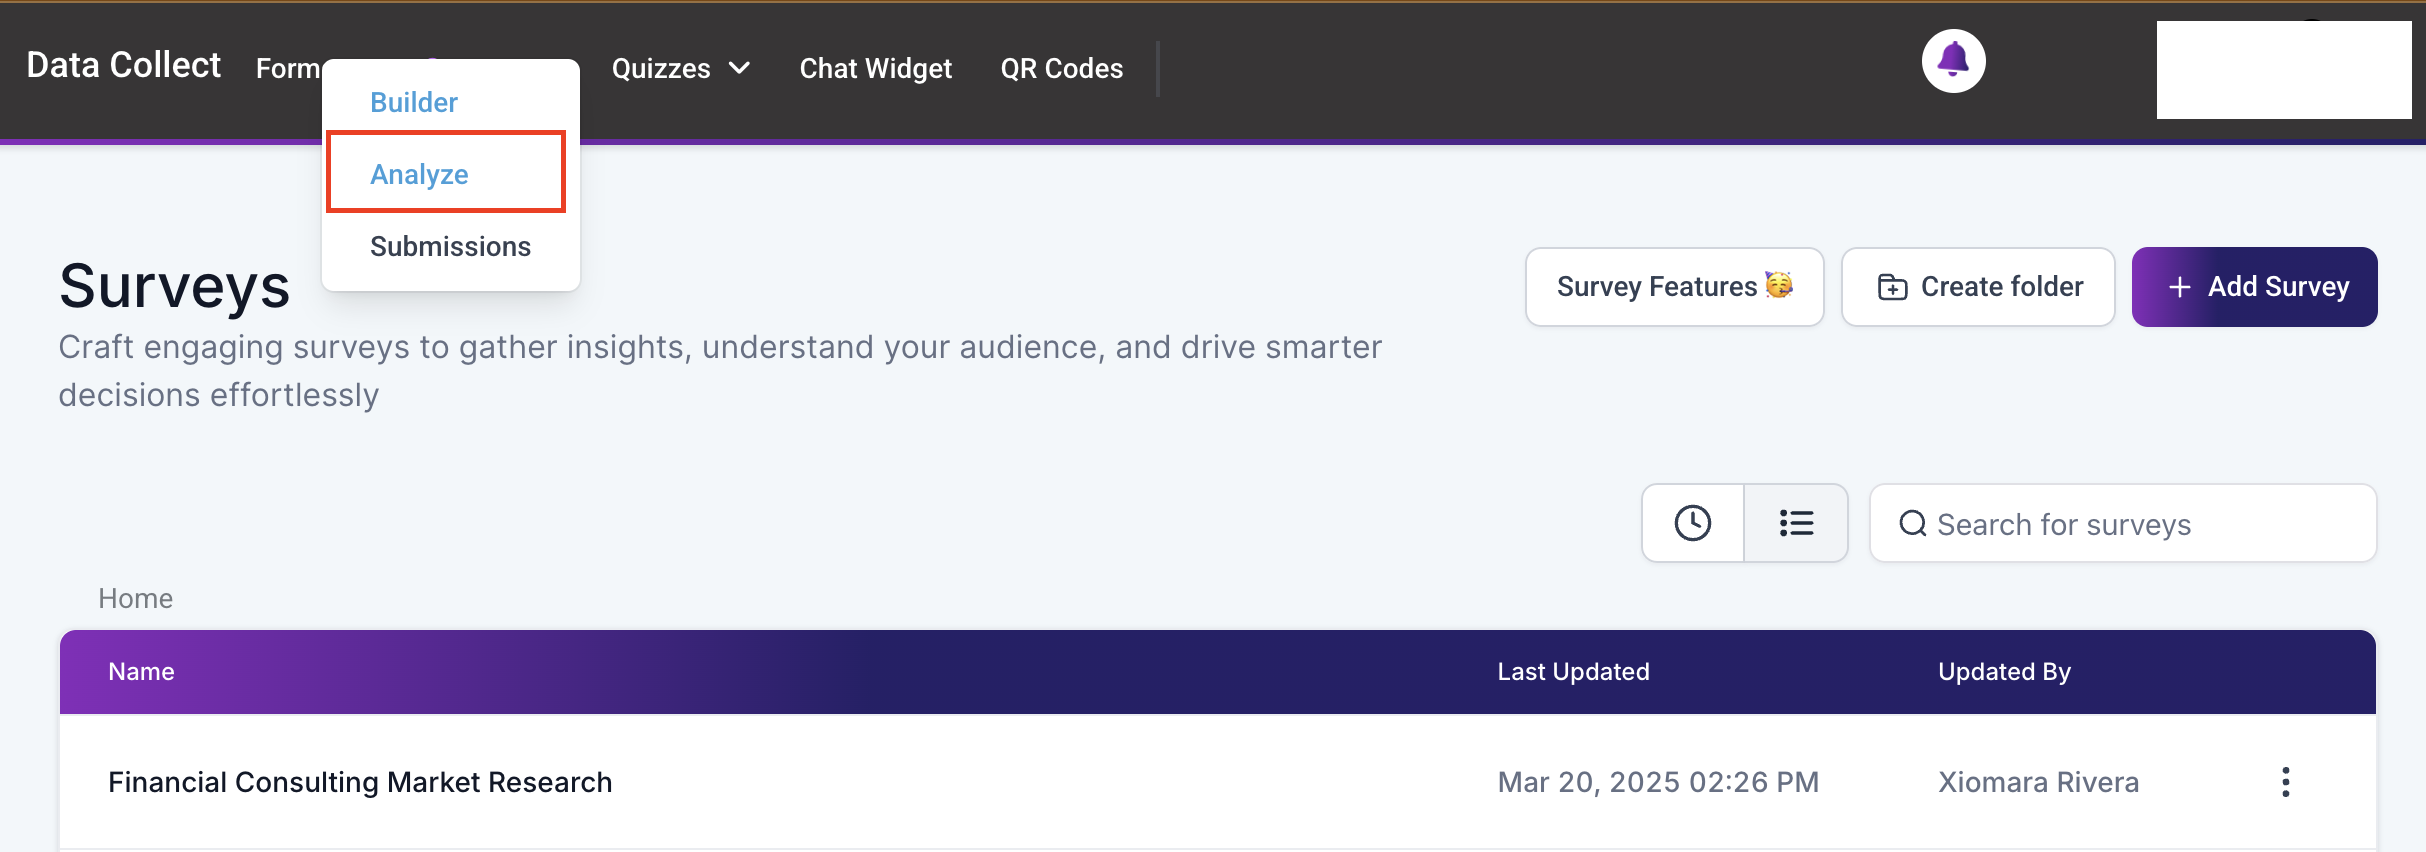
Select the Analytics option from the Surveys drop-down menu, immediately bringing you to the Survey Results.
Once inside the tab, you’ll find a few elements, so, let’s give them a check.
Survey Selector #
This dropdown menu allows you to specify which results you want to see. Your surveys will be listed by name so you can select the desired one. By default, the system will show you an overview of all surveys at once.

Time Frame #
To change the dates the Graph is representing click this option.

A calendar will open for you to select the new dates. Once you’ve highlighted the new dates, click confirm to update them.

Total Views #
This represents the number of times a survey has been opened, this only counts one view from any unique IP address.

Responses #
This is the total amount of submitted responses.

Average Time #
This will be the average time it takes users to fill out and submit the survey.

Completion rate #
This percentage represents the amount of submissions your survey receives concerning how many times it is viewed.

Graph #
This Graph will illustrate your results on the selected time frame, depending on which option and timeframe you select, the view will change.

Survey Spread #
This short section at the bottom will provide you with added insights, this works differently depending on whether a single survey was selected or not
For All View #
This will show you the information breakdown by survey, for example, how many views belong to Survey 1 vs Survey 2.

Single Survey View #
This will give you a page-by-page breakdown of the views you received and where customers disengage with your survey.

This will help you maximize the results you get from your surveys and better understand customer behavior. Give a view to your Survey Analysis tab and leverage those statistics into efficiency!
What's your Reaction?
You have reacted on"Analyze Surveys"
A few seconds ago


 Subscriptions
 My Orders
 My Wishlist
 Refer & Earn💸
 My Projects
 Conversations
 Website Services
 New Website Request
 Website Addons
 Graphic Design
 Video Production
 Marketing Services
 Get a Marketing Plan
 Local SEO Audit

 Latest Updates
 Consultation Calls
 Tools & Extensions